
Subtype Forest Plot
plot_subtype_forest.RdCreate a subtype aware forest plot, with a set clinical end-point.
Usage
plot_subtype_forest(
  these_predictions = NULL,
  these_samples_metadata = NULL,
  this_subtype = NULL,
  subtype_class = "5_class",
  surv_event = NULL,
  sig_color = "red",
  significant_p = 0.05,
  surv_time = NULL,
  sample_id_col = NULL,
  row_to_col = FALSE,
  plot_title = NULL,
  plot_subtitle = NULL,
  plot_caption = NULL,
  plot_width = 7,
  plot_height = 7,
  out_format = "png",
  out_path = NULL,
  file_name = NULL,
  return_data = FALSE
)
Arguments
- these_predictions
Required parameter if
this_metadatais not provided. Should be output fromclassify_samples().- these_samples_metadata
Required parameter if
these_predictionsis not provided or to provide survival data. Metadata associated with the prediction output.- this_subtype
A character vector specifying the subtypes to be included in the plot. Default is c("UroA", "UroB", "UroC", "Uro", "GU", "BaSq", "Mes", "ScNE").
- subtype_class
Can be one of the following; 5_class or 7_class. Default is 5_class.
- surv_event
A string specifying the column name for the survival event.
- sig_color
Color for annotating significant signatures. Default is red.
- significant_p
Numeric parameter for flagging significant p values. Default is 0.05.
- surv_time
A string specifying the column name for the survival time.
- sample_id_col
Optional parameter. Allows the user to manually specify the name of a column with sample ID.
- row_to_col
Optional parameter, set to TRUE to convert row names in metadata to a new column called sample_id. Default is FALSE.
- plot_title
A string specifying the title of the plot.
- plot_subtitle
A string specifying the subtitle of the plot.
- plot_caption
A string specifying the caption of the plot.
- plot_width
A numeric value specifying the width of the plot. Default is 7.
- plot_height
A numeric value specifying the height of the plot. Default is 7.
- out_format
A string specifying the output format of the plot ("png" or "pdf"). Default is "png".
- out_path
A string specifying the output path for saving the plot.
- file_name
A string specifying the file name for the saved plot.
- return_data
Set to TRUE to return plot data, default is FALSE.
Value
A combined plot object if out_path is NULL. Otherwise, the plot is saved to the
specified path.
Details
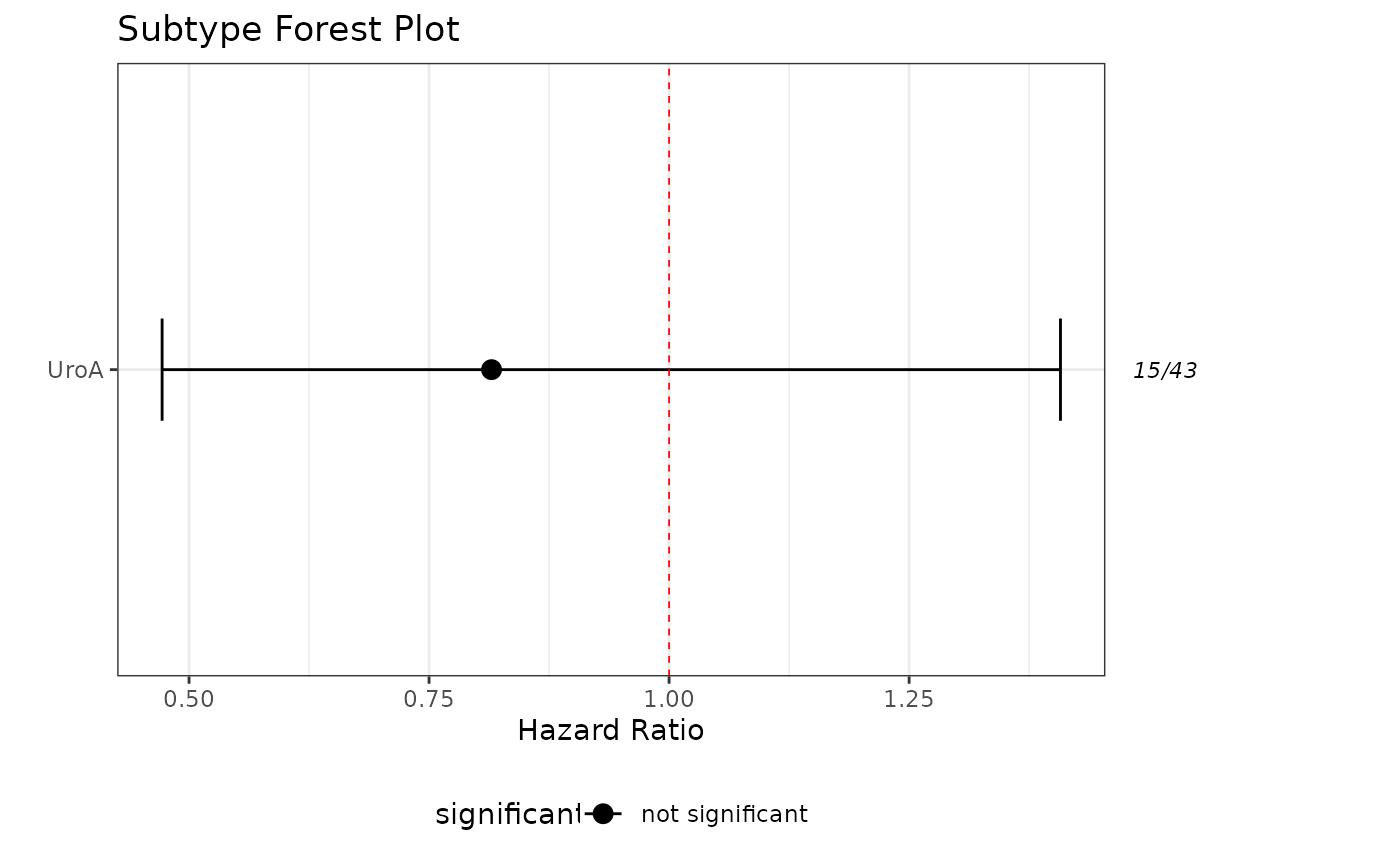
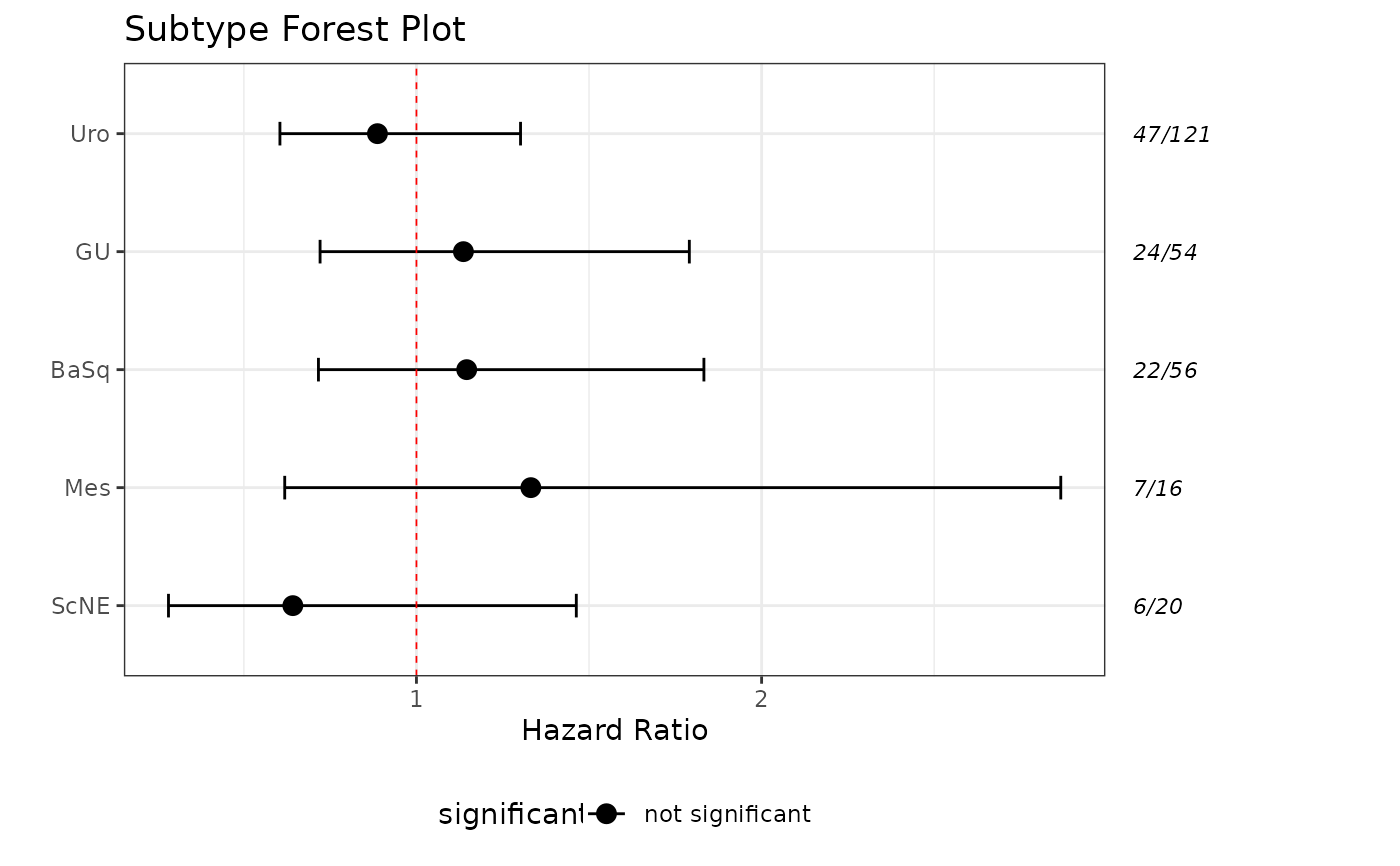
This function creates a forest plot for multiple subtypes based on Cox proportional hazards models. It also includes a table with the number of samples and progression events for each subtype.
Examples
#run classifier
sjodahl_classes = classify_samples(this_data = sjodahl_2017,
log_transform = FALSE,
adjust = TRUE,
impute = TRUE,
include_data = TRUE,
verbose = FALSE)
#UroA
plot_subtype_forest(these_samples_metadata = sjodahl_2017_meta,
these_predictions = sjodahl_classes,
this_subtype = "UroA",
subtype_class = "7_class",
surv_event = "surv_css_event",
surv_time = "surv_css_time")
#> `height` was translated to `width`.
 #all 5 class subtypes
plot_subtype_forest(these_samples_metadata = sjodahl_2017_meta,
these_predictions = sjodahl_classes,
this_subtype = NULL,
subtype_class = "5_class",
surv_event = "surv_css_event",
surv_time = "surv_css_time")
#> `height` was translated to `width`.
#all 5 class subtypes
plot_subtype_forest(these_samples_metadata = sjodahl_2017_meta,
these_predictions = sjodahl_classes,
this_subtype = NULL,
subtype_class = "5_class",
surv_event = "surv_css_event",
surv_time = "surv_css_time")
#> `height` was translated to `width`.
 #return data
forest_data = plot_subtype_forest(these_samples_metadata = sjodahl_2017_meta,
these_predictions = sjodahl_classes,
subtype_class = "5_class",
this_subtype = c("Uro", "GU", "BaSq", "Mes", "ScNE"),
return_data = TRUE,
surv_event = "surv_css_event",
surv_time = "surv_css_time")
#> No plot generated, returning data instead...
#view data
head(forest_data)
#> subtype p_value ratio conf_2.5 conf_97.5 significant
#> 1 Uro 0.5400061 0.8870096 0.6044836 1.301584 not significant
#> 2 GU 0.5825919 1.1360788 0.7207983 1.790619 not significant
#> 3 BaSq 0.5707407 1.1456109 0.7160574 1.832848 not significant
#> 4 Mes 0.4644418 1.3314314 0.6183662 2.866763 not significant
#> 5 ScNE 0.2916031 0.6418849 0.2815931 1.463162 not significant
#return data
forest_data = plot_subtype_forest(these_samples_metadata = sjodahl_2017_meta,
these_predictions = sjodahl_classes,
subtype_class = "5_class",
this_subtype = c("Uro", "GU", "BaSq", "Mes", "ScNE"),
return_data = TRUE,
surv_event = "surv_css_event",
surv_time = "surv_css_time")
#> No plot generated, returning data instead...
#view data
head(forest_data)
#> subtype p_value ratio conf_2.5 conf_97.5 significant
#> 1 Uro 0.5400061 0.8870096 0.6044836 1.301584 not significant
#> 2 GU 0.5825919 1.1360788 0.7207983 1.790619 not significant
#> 3 BaSq 0.5707407 1.1456109 0.7160574 1.832848 not significant
#> 4 Mes 0.4644418 1.3314314 0.6183662 2.866763 not significant
#> 5 ScNE 0.2916031 0.6418849 0.2815931 1.463162 not significant