
Visualize Subtype Prediction Scores in A Violin-style plot
plot_subscore_violin.RdVisualize subtype prediction score for a set subtype in a violin plot.
Usage
plot_subscore_violin(
  these_predictions,
  this_subtype,
  out_path = NULL,
  out_format = "png",
  plot_width = 4,
  plot_height = 4,
  plot_adjust = 2,
  plot_scale = "width",
  plot_trim = FALSE,
  return_data = FALSE
)
Arguments
- these_predictions
Required parameter, should be the output from
classify_samples().- this_subtype
Required parameter. Should be one of the set subtype classes from the LundTax nomenclature.
- out_path
Optional, set path to export plot.
- out_format
Required parameter if
out_pathis specified. Can be "png" (default) or "pdf". The user can further specify the dimensions of the returned plot withplot_widthandplot_height.- plot_width
This parameter controls the width in inches. Default is 4 (1200 pixels at 300 PPI).
- plot_height
This parameter controls the height in inches. Default is 4 (1200 pixels at 300 PPI).
- plot_adjust
A multiplicate bandwidth adjustment. This makes it possible to adjust the bandwidth while still using the a bandwidth estimator. For example, adjust = 1/2 means use half of the default bandwidth.
- plot_scale
if "area" (default), all violins have the same area (before trimming the tails). If "count", areas are scaled proportionally to the number of observations. If "width", all violins have the same maximum width.
- plot_trim
If TRUE (default), trim the tails of the violins to the range of the data. If FALSE, don't trim the tails.
- return_data
Set to TRUE to return tidy data used by the plotting function. Default is FALSE.
Details
Take the output from classify_samples and return a violin plot where each violin
represent the distribution of the, for that class, subtype prediction score. Set the subtype of
desire with this_subtype. The subtype can be one of the subtypes included in the LundTax
subtype classification nomenclature. Parameters starting with the plot prefix are available for
the user to gain more control of the returned plot. The user can also return the wrangled data
used in the plot by setting return_data = TRUE.
Examples
#run predictor
sjodahl_classes = classify_samples(this_data = sjodahl_2017,
log_transform = FALSE,
adjust = TRUE,
impute = TRUE,
include_data = TRUE,
verbose = FALSE)
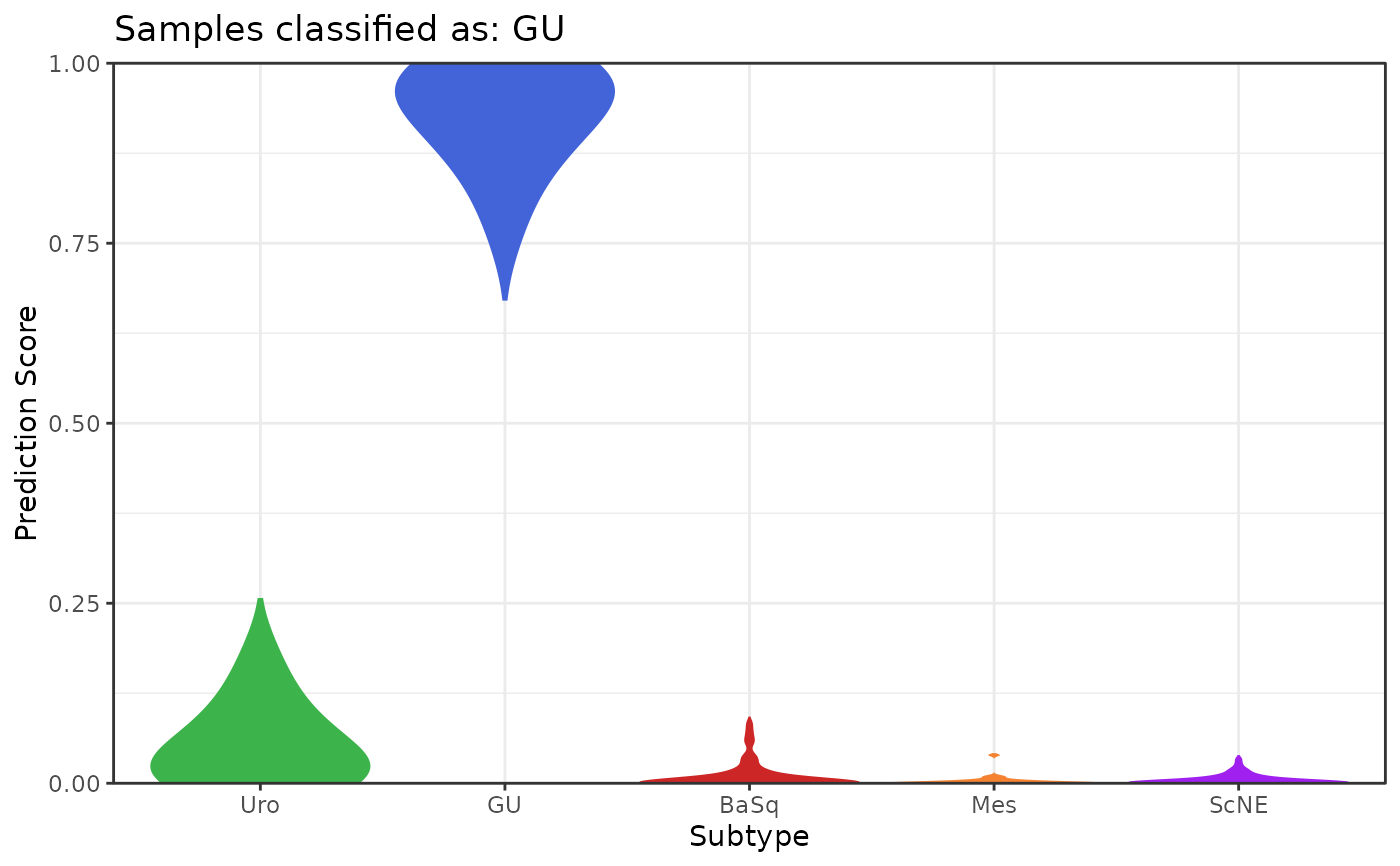
#plot GU
plot_subscore_violin(these_predictions = sjodahl_classes,
this_subtype = "GU",
plot_adjust = 2,
plot_trim = FALSE)
#> Warning: Arguments in `...` must be used.
#> ✖ Problematic argument:
#> • show.legend = FALSE
#> ℹ Did you misspell an argument name?
#> Warning: Removed 344 rows containing missing values or values outside the scale range
#> (`geom_violin()`).
 #plot UroA
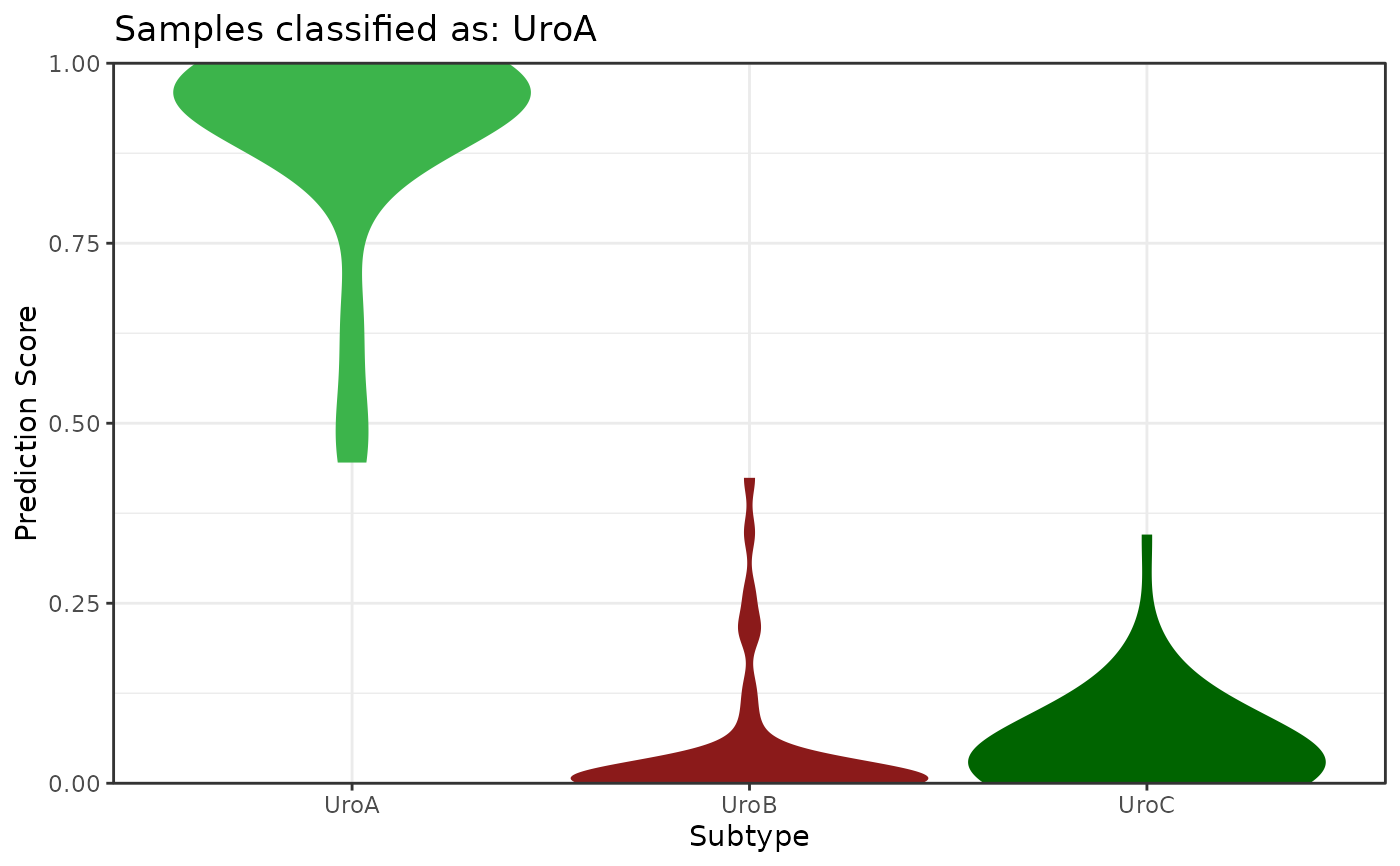
plot_subscore_violin(these_predictions = sjodahl_classes,
this_subtype = "UroA",
plot_adjust = 3,
plot_scale = "width",
plot_trim = TRUE, return_data = FALSE)
#> Warning: Arguments in `...` must be used.
#> ✖ Problematic argument:
#> • show.legend = FALSE
#> ℹ Did you misspell an argument name?
#plot UroA
plot_subscore_violin(these_predictions = sjodahl_classes,
this_subtype = "UroA",
plot_adjust = 3,
plot_scale = "width",
plot_trim = TRUE, return_data = FALSE)
#> Warning: Arguments in `...` must be used.
#> ✖ Problematic argument:
#> • show.legend = FALSE
#> ℹ Did you misspell an argument name?
 #return data
plot_data = plot_subscore_violin(these_predictions = sjodahl_classes,
this_subtype = "UroA",
return_data = TRUE)
#> No plot generated, returning tidy data instead...
#view data
head(plot_data)
#> sample_id subtype value
#> 1 1.CEL UroA 0.9350
#> 2 4.CEL UroA 0.9334
#> 3 15.CEL UroA 0.9868
#> 4 28.CEL UroA 0.9838
#> 5 37.CEL UroA 0.9530
#> 6 45.CEL UroA 0.9996
#return data
plot_data = plot_subscore_violin(these_predictions = sjodahl_classes,
this_subtype = "UroA",
return_data = TRUE)
#> No plot generated, returning tidy data instead...
#view data
head(plot_data)
#> sample_id subtype value
#> 1 1.CEL UroA 0.9350
#> 2 4.CEL UroA 0.9334
#> 3 15.CEL UroA 0.9868
#> 4 28.CEL UroA 0.9838
#> 5 37.CEL UroA 0.9530
#> 6 45.CEL UroA 0.9996