
Visualize Subtype Prediction Scores in a Sorted/ranked/stacked Barplot
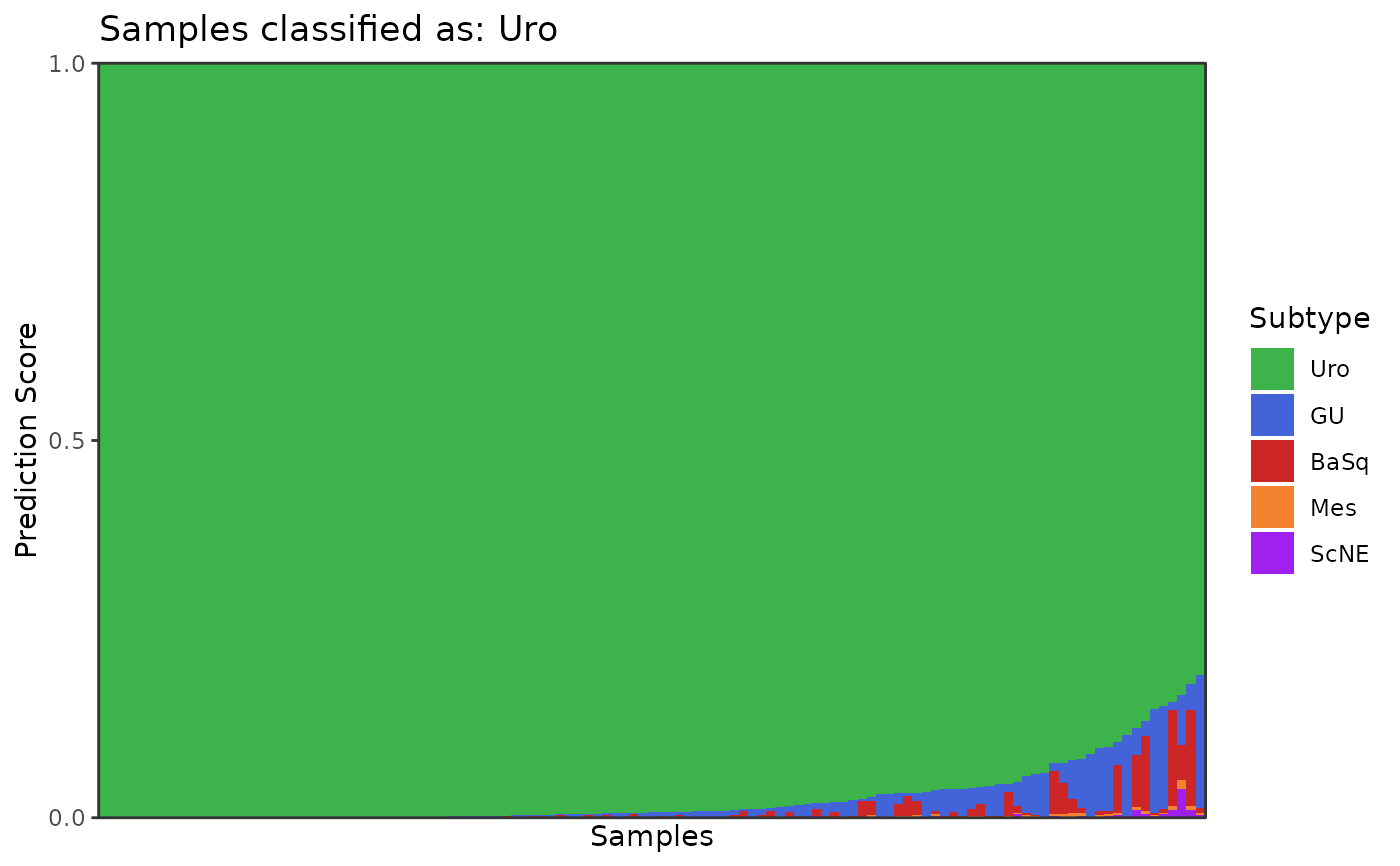
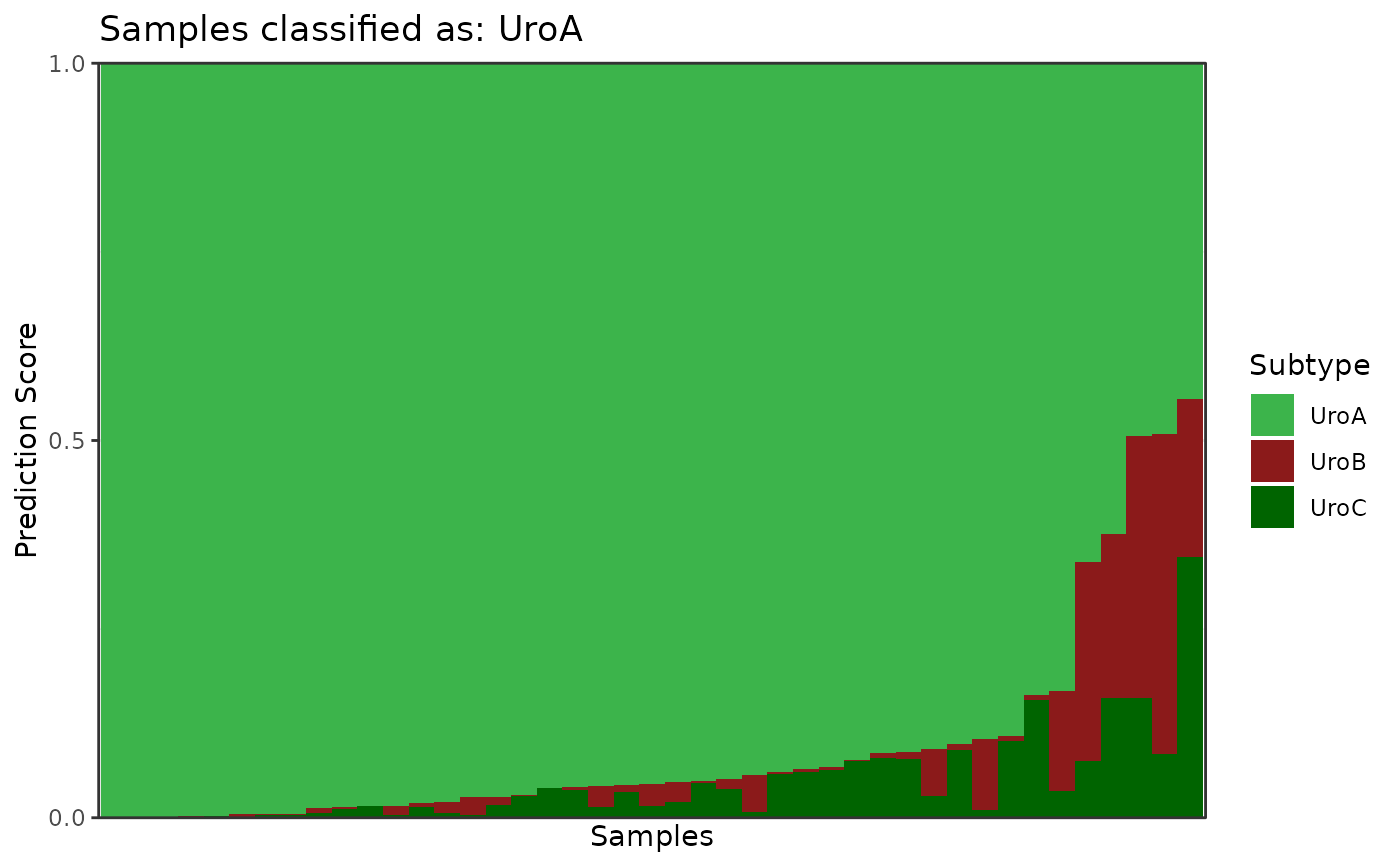
plot_subscore_box.RdVisualize subtype prediction score within a set subtype in a stacked barplot.
Usage
plot_subscore_box(
  these_predictions,
  this_subtype,
  out_path = NULL,
  out_format = "png",
  plot_width = 4,
  plot_height = 4,
  return_data = FALSE
)
Arguments
- these_predictions
Required parameter, should be the output from
classify_samples().- this_subtype
Required parameter. Should be one of the set subtype classes from the LundTax nomenclature.
- out_path
Optional, set path to export plot.
- out_format
Required parameter if
out_pathis specified. Can be "png" (default) or "pdf". The user can further specify the dimensions of the returned plot withplot_widthandplot_height.- plot_width
This parameter controls the width in inches. Default is 4 (1200 pixels at 300 PPI).
- plot_height
This parameter controls the height in inches. Default is 4 (1200 pixels at 300 PPI).
- return_data
Set to TRUE to return tidy data used by the plotting function. Default is FALSE.
Details
Take the output from classify_samples and return a stacked barplot plot representing
the distribution of the, for that class, subtype prediction score. Set the subtype of
desire with this_subtype. The subtype can be one of the subtypes included in the LundTax
subtype classification nomenclature.
Examples
#run predictor
sjodahl_classes = classify_samples(this_data = sjodahl_2017,
log_transform = FALSE,
adjust = TRUE,
impute = TRUE,
include_data = TRUE,
verbose = FALSE)
#plot Uro scores
plot_subscore_box(these_predictions = sjodahl_classes,
this_subtype = "Uro")
 #plot UroA scores
plot_subscore_box(these_predictions = sjodahl_classes,
this_subtype = "UroA")
#plot UroA scores
plot_subscore_box(these_predictions = sjodahl_classes,
this_subtype = "UroA")
 #return data
plot_data = plot_subscore_box(these_predictions = sjodahl_classes,
this_subtype = "Uro",
return_data = TRUE)
#> No plot generated, returning tidy data instead...
#view data
head(plot_data)
#> # A tibble: 6 × 3
#> sample_id subtype value
#> <fct> <fct> <dbl>
#> 1 15.CEL Uro 1
#> 2 15.CEL GU 0
#> 3 15.CEL BaSq 0
#> 4 15.CEL Mes 0
#> 5 15.CEL ScNE 0
#> 6 45.CEL Uro 1
#return data
plot_data = plot_subscore_box(these_predictions = sjodahl_classes,
this_subtype = "Uro",
return_data = TRUE)
#> No plot generated, returning tidy data instead...
#view data
head(plot_data)
#> # A tibble: 6 × 3
#> sample_id subtype value
#> <fct> <fct> <dbl>
#> 1 15.CEL Uro 1
#> 2 15.CEL GU 0
#> 3 15.CEL BaSq 0
#> 4 15.CEL Mes 0
#> 5 15.CEL ScNE 0
#> 6 45.CEL Uro 1