
Subtype-dependent Visualization of Signature Scores in a Heatmap
plot_signatures_heatmap.RdBuild a heatmap with signature scores retrieved with the classify_samples() function.
Usage
plot_signatures_heatmap(
  these_predictions = NULL,
  proportional_scores = FALSE,
  out_path = NULL,
  out_format = "png",
  return_scores = FALSE,
  to_xlsx = FALSE,
  plot_title = NULL,
  hm_split = NULL,
  subtype_annotation = "5_class",
  hm_cluster = FALSE,
  plot_anno_legend = c(TRUE, FALSE, TRUE, TRUE, FALSE, TRUE),
  plot_hm_legend = FALSE,
  plot_width = 14,
  plot_height = 6,
  plot_font_size = 12,
  verbose = TRUE
)
Arguments
- these_predictions
A list with a data frame object called scores. Returned with
classify_samples().- proportional_scores
Set to TRUE to transform signature scores into proportions, default is FALSE.
- out_path
Optional, set path to export plot. If not provided, tidy version of incoming scores in data frame format will be returned (
return_scoreswill be auto-defaulted to TRUE).- out_format
Required parameter if
out_pathis specified. Can be "png" (default) or "pdf". The user can further specify the dimensions of the returned plot withplot_widthandplot_height.- return_scores
Set to TRUE to return prediction scores in a tidy format. Default is FALSE.
- to_xlsx
Boolean parameter, set to TRUE to export score data frame in xlsx format. Default is FALSE. If set to TRUE, the spreadsheet will be saved to the same path as the heatmap.
- plot_title
Required parameter. Heatmap title, will also be pasted to the exported file(s) as well as a new column in the scores data frame under cohort.
- hm_split
Optional parameter for controlling how the data is split into different groups. If not provided, the function will split on what is specified within
subtype_annotation.- subtype_annotation
Can be one of the following; "5_class" (default) or "7_class" annotation.
- hm_cluster
Boolean parameter, set to TRUE to cluster the rows (default is FALSE).
- plot_anno_legend
Expects a vector with TRUE/FALSE (7 in total), thsi decides what legends will be on the final heatmap. Default is to only show the legend for the subtypes.
- plot_hm_legend
Boolean parameter. Set to TRUE to show heatmap legend. Default is FALSE.
- plot_width
This parameter controls the width in inches. Default is 14(4200 pixels at 300 PPI).
- plot_height
This parameter controls the height in inches. Default is 6(1800 pixels at 300 PPI)
- plot_font_size
Optional parameter to control the size of the font in the generated heatmap. Note, the title of the plot will always be twice that of the set value here (default = 12).
- verbose
Set to TRUE for debugging purposes. Default is FALSE.
Value
Data frame with prediction score for each sample and class, if return_scores = TRUE. Otherwise, nothing.
Details
Construct and export (pdf or png) a highly customizable heatmap visualizing prediction
scores for each sample and class, predicted with classify_samples().
This function depends on Complexheatmap. It is also possible to return a data frame with
prediction scores in a tidy format. To do so, set return_scores = TRUE. For a greater explanation
on how to use the function, see parameter descriptions and examples.
Examples
#run classifier
sjodahl_classes = classify_samples(this_data = sjodahl_2017,
log_transform = FALSE,
adjust = TRUE,
impute = TRUE,
include_data = TRUE,
verbose = FALSE)
#plot 5 class
plot_signatures_heatmap(these_predictions = sjodahl_classes,
plot_title = "Signature Scores (Sjodahl 2017)",
return_scores = FALSE,
plot_anno_legend = FALSE,
subtype_annotation = "5_class")
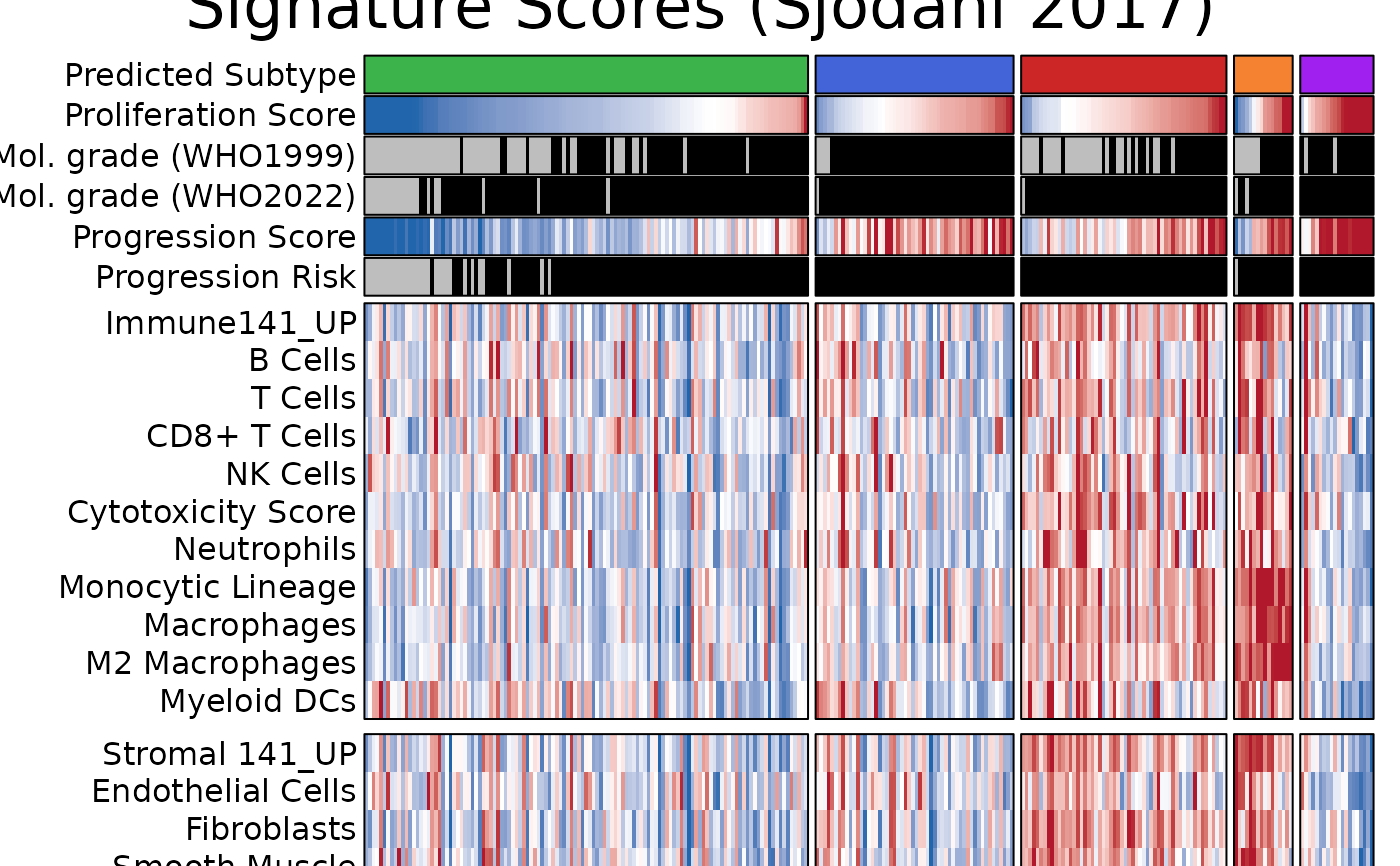 #> No output path provided, displaying heatmap in R...
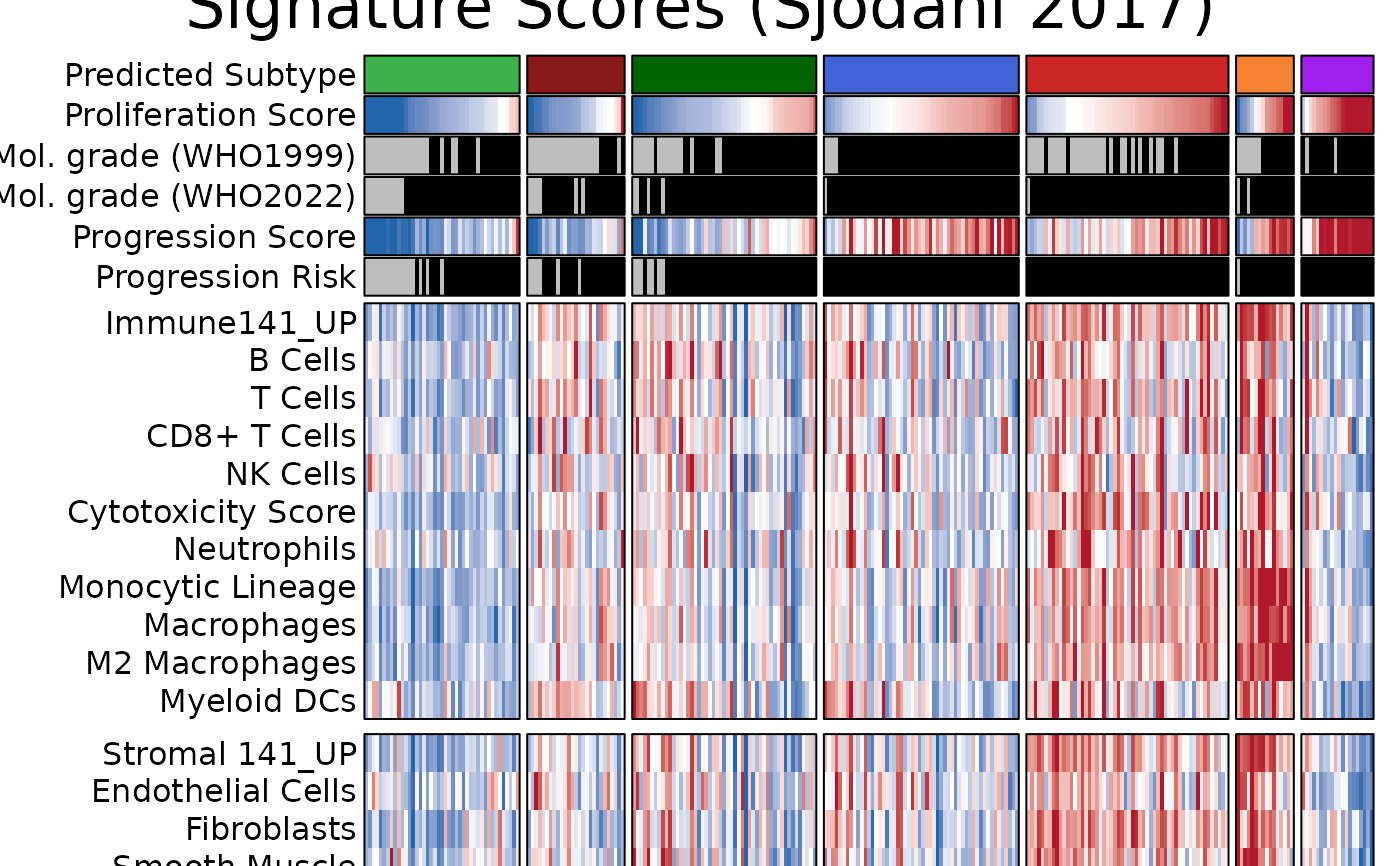
#plot 7 class
plot_signatures_heatmap(these_predictions = sjodahl_classes,
plot_title = "Signature Scores (Sjodahl 2017)",
return_scores = FALSE,
plot_anno_legend = FALSE,
subtype_annotation = "7_class")
#> No output path provided, displaying heatmap in R...
#plot 7 class
plot_signatures_heatmap(these_predictions = sjodahl_classes,
plot_title = "Signature Scores (Sjodahl 2017)",
return_scores = FALSE,
plot_anno_legend = FALSE,
subtype_annotation = "7_class")
 #> No output path provided, displaying heatmap in R...