
Visualize Signature Scores (Cox or GLM) in a Forest Plot
plot_ratio_forest.RdConstruct a forest plot using Cox model or generalized linnear model for a set of signature scores.
Usage
plot_ratio_forest(
  these_predictions = NULL,
  these_samples_metadata = NULL,
  this_data = NULL,
  stat_plot,
  this_subtype = NULL,
  subtype_class = "5_class",
  scale = NULL,
  bin_scores = TRUE,
  n_bins = 10,
  surv_time = NULL,
  surv_event = NULL,
  categorical_factor = NULL,
  predictor_columns = NULL,
  exclude_columns = NULL,
  significant_p = 0.05,
  col_bon = FALSE,
  sig_color = "red",
  sample_id_col = NULL,
  row_to_col = FALSE,
  out_path = NULL,
  out_format = "png",
  file_name = "my_plot",
  plot_title = "My Plot",
  plot_subtitle = "",
  plot_width = 8,
  plot_height = 8,
  plot_order = NULL,
  plot_arrange = TRUE,
  return_data = FALSE
)
Arguments
- these_predictions
Required parameter if
this_datais not provided. Should be output fromclassify_samples().- these_samples_metadata
Required parameter if
this_datais not provided. Metadata associated with he prediction output. Also possible for the user to provide a metadata subset with samples of interest, the return will be restricted to the samples within the specified group- this_data
Required parameter if
these_predictionsandthese_samples_metadatais not provided. Should be the output fromget_survivalorget_glm, depending on the plot type set withstat_plot.- stat_plot
Required parameter. Sets the plot type, for hazard ratio, set to
hazard_ratio. For odds ratio, set toodds_ratio.- this_subtype
Optional Specify subtype of interest. Leave as NULL to not separate statistics on subtype.
- subtype_class
Can be one of the following; 5_class or 7_class. Default is 5_class.
- scale
Optional parameter. A numeric value to scale the numeric scores. If provided, all numeric scores will be multiplied by this value.
- bin_scores
Boolean parameter. Set to TRUE to bin the numeric scores into discrete bins. Default is TRUE
- n_bins
Optional parameter. The number of bins to use when binning numeric scores. Default is 10.
- surv_time
Required parameter if
stat_plotis set tohazard_ratio, should be the name of the column in the metadata with survival time. Should be of value numeric.- surv_event
Required parameter if
stat_plotis set tohazard_ratio, should be the name of the column in the metadata with survival event. Should be of value factor, with two levels.- categorical_factor
Required parameter if
this_glmis not provided. This should be the categorical variable that is intended for testing. In addition, this should also be a variable of type factor, with exactly 2 levels.- predictor_columns
Optional, should be a vector with column names, either from the provided metadata or signature score object, to be tested for. If not provided, the function will subset data to the signature scores returned with
classify_samples.- exclude_columns
Optional argument, specify columns you wish to exclude from the standard predictor columns. Note, this parameter is only validated if predictor_columns is NULL (default).
- significant_p
Numeric parameter for flagging significant p values. Default is 0.05.
- col_bon
Boolean parameter, if set to TRUE the p values will be bonferroni adjusted. Default is FALSE.
- sig_color
Color for annotating significant signatures. Default is red.
- sample_id_col
Optional parameter. Allows the user to manually specify the name of a column with sample ID.
- row_to_col
Optional parameter, set to TRUE to convert row names in metadata to a new column called sample_id. Default is FALSE.
- out_path
Optional, set path to export plot.
- out_format
Required parameter if
out_pathis specified. Can be "png" (default) or "pdf". The user can further specify the dimensions of the returned plot withplot_widthandplot_height.- file_name
Optional, if plot is being saved to disk, specify the file name for the file.
- plot_title
Optional parameter, set title for the plot. Default is "My Plot".
- plot_subtitle
Optional parameter, set subtitle for the plot. Default is "".
- plot_width
This parameter controls the width in inches. Default is 8 (2400 pixels at 300 PPI).
- plot_height
This parameter controls the height in inches. Default is 8 (2400 pixels at 300 PPI).
- plot_order
Optional parameter for setting the order of scores in the returned plot. Only applies if
arrange_plotis set to TRUE.- plot_arrange
Boolean parameter, if set to TRUE the user can specify the order of the score levels on the y axis. Default is FALSE.
- return_data
Boolean parameter, set to TRUE and return the formatted data used for plotting. Default is FALSE
Details
Depending on the user defines stat_plot, this function internally calls get_survival
or get_glm, which internally calls int_prediction_wrangler. The user can also provide the
plotting data with this_data directly. If plot_data is set to odds_ratio the function will
visualize odds ratio for one selected categorical variable. The user sets this variable with
categorical_factor.This should be a valid column name from either the metadata provided with
these_samples_metadata or from the signature score data subset. The user can then set what
numerical columns that are to be tested for association. This is controlled with
predictor_columns. The input for this parameter should match column names corresponding to
numeric variables in the metadata or signature score data subset. Alternatively, the function can
also visualize hazard ratios calculated with get_surv. To do so, set
plot_data = "hazard_ratio". If so, the user also needs to point the function to the
corresponding survival columns in the provided metadata. This is done with surv_time and
surv_event. To return a plot for just one subtype, specify the subtype and class with
this_subtype and subtype_class. To return a plot for more than one subtype, it is recommended
to provide the plot data directly with this_data.
Examples
#run predictor
sjodahl_classes = classify_samples(this_data = sjodahl_2017,
log_transform = FALSE,
adjust = TRUE,
impute = TRUE,
include_data = TRUE,
verbose = FALSE)
#hazard ratio
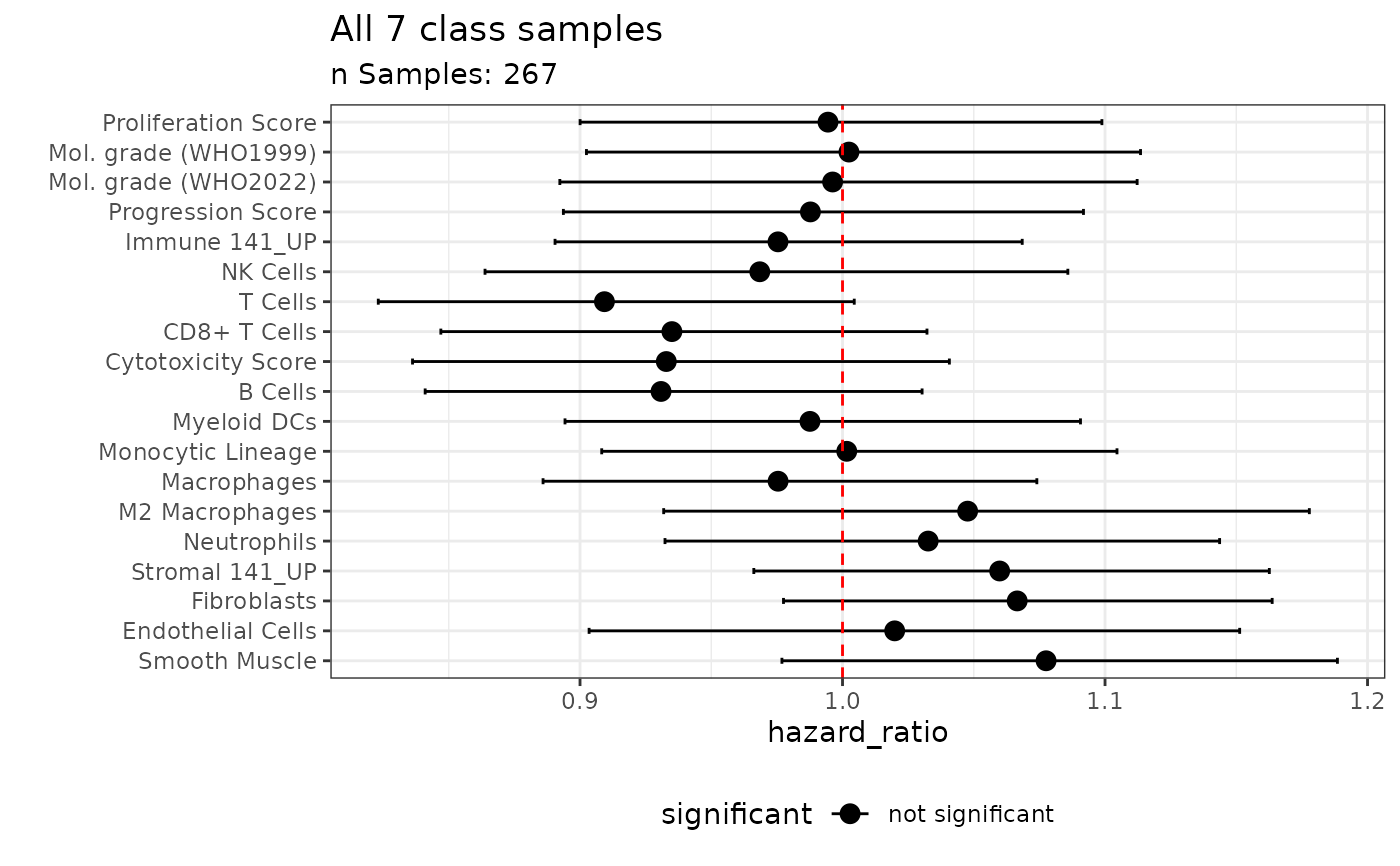
plot_ratio_forest(these_predictions = sjodahl_classes,
these_samples_metadata = sjodahl_2017_meta,
stat_plot = "hazard_ratio",
bin_scores = TRUE,
sig_color = "salmon",
col_bon = FALSE,
plot_subtitle = "n Samples: 267",
plot_title = "All 7 class samples",
subtype_class = "7_class",
this_subtype = NULL,
return_data = FALSE,
plot_arrange = TRUE,
surv_time = "surv_css_time",
surv_event = "surv_css_event")
#> 267 samples kept after filtering on subtype and metadata...
#> `height` was translated to `width`.
 #odds ratio
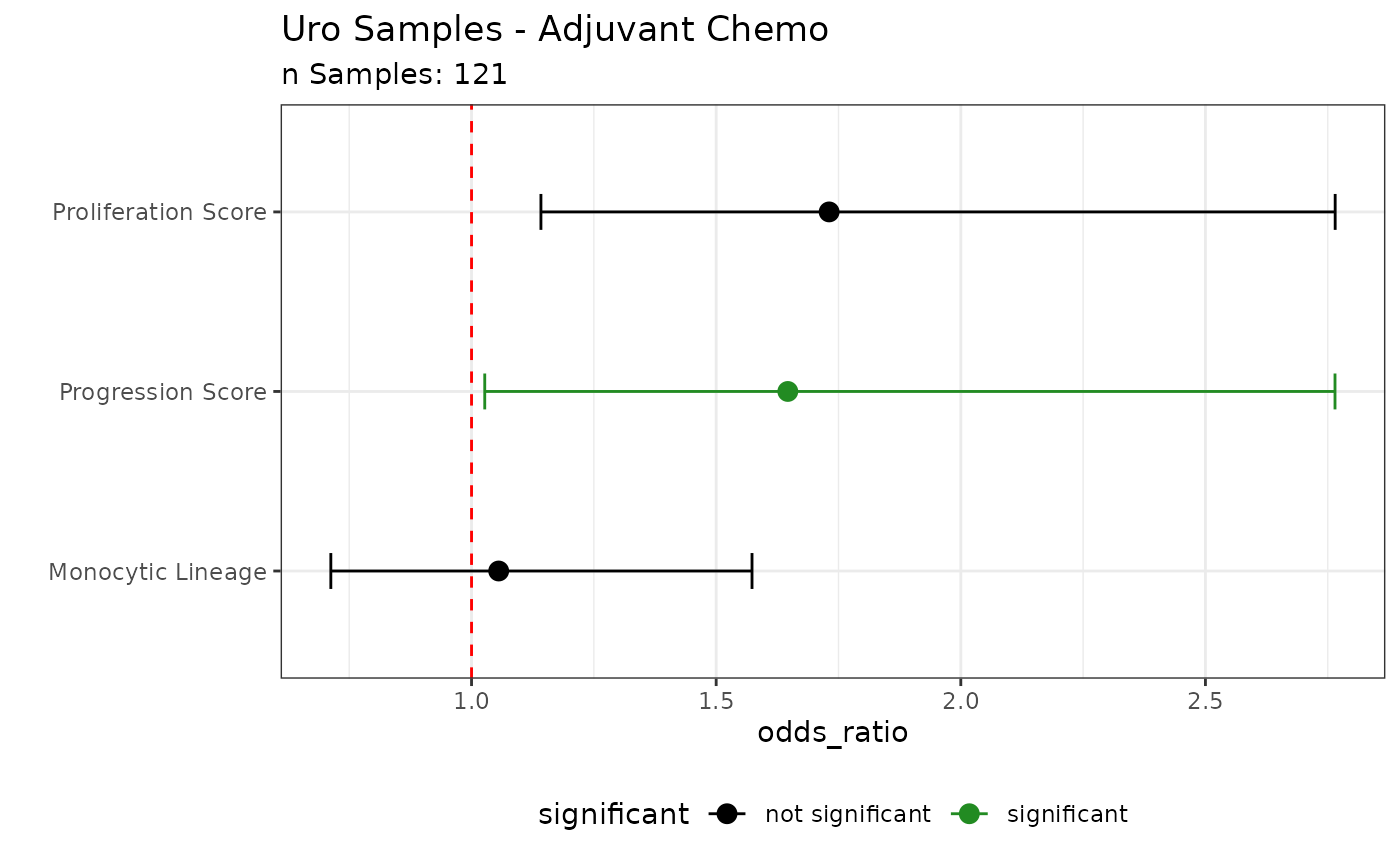
plot_ratio_forest(these_predictions = sjodahl_classes,
these_samples_metadata = sjodahl_2017_meta,
stat_plot = "odds_ratio",
plot_title = "Uro Samples - Adjuvant Chemo",
plot_subtitle = "n Samples: 121",
subtype_class = "5_class",
col_bon = TRUE,
return_data = FALSE,
sig_color = "forestgreen",
this_subtype = "Uro",
categorical_factor = "adj_chemo",
predictor_columns = c("progression_score",
"proliferation_score",
"monocytic_lineage"))
#> Filtering prediction data on the selected subtype(s)...
#> 121 samples kept after filtering on subtype and metadata...
#> `height` was translated to `width`.
#odds ratio
plot_ratio_forest(these_predictions = sjodahl_classes,
these_samples_metadata = sjodahl_2017_meta,
stat_plot = "odds_ratio",
plot_title = "Uro Samples - Adjuvant Chemo",
plot_subtitle = "n Samples: 121",
subtype_class = "5_class",
col_bon = TRUE,
return_data = FALSE,
sig_color = "forestgreen",
this_subtype = "Uro",
categorical_factor = "adj_chemo",
predictor_columns = c("progression_score",
"proliferation_score",
"monocytic_lineage"))
#> Filtering prediction data on the selected subtype(s)...
#> 121 samples kept after filtering on subtype and metadata...
#> `height` was translated to `width`.
 #return plot data
ratio_data = plot_ratio_forest(these_predictions = sjodahl_classes,
these_samples_metadata = sjodahl_2017_meta,
stat_plot = "odds_ratio",
subtype_class = "5_class",
col_bon = FALSE,
return_data = TRUE,
this_subtype = "Uro",
categorical_factor = "adj_chemo")
#> Filtering prediction data on the selected subtype(s)...
#> 121 samples kept after filtering on subtype and metadata...
#> No plot generated, returning plot data instead...
#view data
head(ratio_data)
#> score p_value ratio conf_2.5 conf_97.5 variable
#> 1 Proliferation Score 0.01978721 1.7308844 1.1418187 2.765177 adj_chemo
#> 2 Progression Score 0.01630708 1.6464287 1.0269821 2.764834 adj_chemo
#> 3 Stromal 141_UP 0.69023479 1.0586900 0.7355220 1.507109 adj_chemo
#> 4 Immune 141_UP 0.78738969 0.9158293 0.6419651 1.296604 adj_chemo
#> 5 B Cells 0.60737341 0.8829891 0.5845830 1.260514 adj_chemo
#> 6 T Cells 0.31610677 0.8126063 0.5428602 1.175414 adj_chemo
#> subtype bonferroni_p_value significant
#> 1 Uro 0.3759569 significant
#> 2 Uro 0.3098345 significant
#> 3 Uro 1.0000000 not significant
#> 4 Uro 1.0000000 not significant
#> 5 Uro 1.0000000 not significant
#> 6 Uro 1.0000000 not significant
#return plot data
ratio_data = plot_ratio_forest(these_predictions = sjodahl_classes,
these_samples_metadata = sjodahl_2017_meta,
stat_plot = "odds_ratio",
subtype_class = "5_class",
col_bon = FALSE,
return_data = TRUE,
this_subtype = "Uro",
categorical_factor = "adj_chemo")
#> Filtering prediction data on the selected subtype(s)...
#> 121 samples kept after filtering on subtype and metadata...
#> No plot generated, returning plot data instead...
#view data
head(ratio_data)
#> score p_value ratio conf_2.5 conf_97.5 variable
#> 1 Proliferation Score 0.01978721 1.7308844 1.1418187 2.765177 adj_chemo
#> 2 Progression Score 0.01630708 1.6464287 1.0269821 2.764834 adj_chemo
#> 3 Stromal 141_UP 0.69023479 1.0586900 0.7355220 1.507109 adj_chemo
#> 4 Immune 141_UP 0.78738969 0.9158293 0.6419651 1.296604 adj_chemo
#> 5 B Cells 0.60737341 0.8829891 0.5845830 1.260514 adj_chemo
#> 6 T Cells 0.31610677 0.8126063 0.5428602 1.175414 adj_chemo
#> subtype bonferroni_p_value significant
#> 1 Uro 0.3759569 significant
#> 2 Uro 0.3098345 significant
#> 3 Uro 1.0000000 not significant
#> 4 Uro 1.0000000 not significant
#> 5 Uro 1.0000000 not significant
#> 6 Uro 1.0000000 not significant