
Plot Ranked Signature Scores in Subtypes
plot_ranked_score.RdReturn a point plot with ranked scores for a set variable.
Usage
plot_ranked_score(
  these_predictions = NULL,
  this_data = NULL,
  this_score = NULL,
  this_subtype = NULL,
  subtype_class = NULL,
  seg_plot = FALSE,
  seg_width = 0.1,
  add_stat = FALSE,
  out_path = NULL,
  out_format = "png",
  plot_width = 8,
  plot_height = 5,
  plot_title = NULL,
  return_data = FALSE
)
Arguments
- these_predictions
Required parameter, if no data provided with
this_data. Predictions returned withclassify_samples().- this_data
Optional parameter, makes it possible for the user to give the plotting function their own data, preferably retrieved with this function with return_data = TRUE. If provided, the plotting function will disregard any other parameters and only draw the plot using the data provided.
- this_score
Required parameter, should be one of the numeric columns in the scores data frame from the list returned with
classify_samples().- this_subtype
Optional parameter, lets the user subset the return to a specific subtype. If nopt provided, all subtypes within the selected class will be returned.
- subtype_class
Required, one of the following; 5_class or 7_class. Needed for coloring the points based on subtype classification.
- seg_plot
Boolean parameter, set to TRUE to return a segment plot with ranked scores for the selected subtype class. Default is FALSE.
- seg_width
Controls the width of the segments if
seg_plot = TRUE.- add_stat
Boolean parameter, set to TRUE to add regression lines, p value for each regression. Default is FALSE.
- out_path
Optional, set path to export plot.
- out_format
Required parameter if
out_pathis specified. Can be "png" (default) or "pdf". The user can further specify the dimensions of the returned plot withplot_widthandplot_height.- plot_width
This parameter controls the width in inches. Default is 4 (1200 pixels at 300 PPI).
- plot_height
This parameter controls the height in inches. Default is 4 (1200 pixels at 300 PPI).
- plot_title
Required parameter, if
out_pathis specified. plot title, will also be pasted to the exported file.- return_data
Boolean parameter, set to TRUE and return the formatted data used for plotting. Default is FALSE
Details
This function takes predictions returned with classify_samples(),
together with a score variable, subtype class and returns a point plot (grob) with ranked scores
along the x axis and scores along the y axis. The returned plot will also color fill the points
based on subtype classification.
Examples
#run classifier
sjodahl_classes = classify_samples(this_data = sjodahl_2017,
log_transform = FALSE,
adjust = TRUE,
impute = TRUE,
include_data = TRUE,
verbose = FALSE)
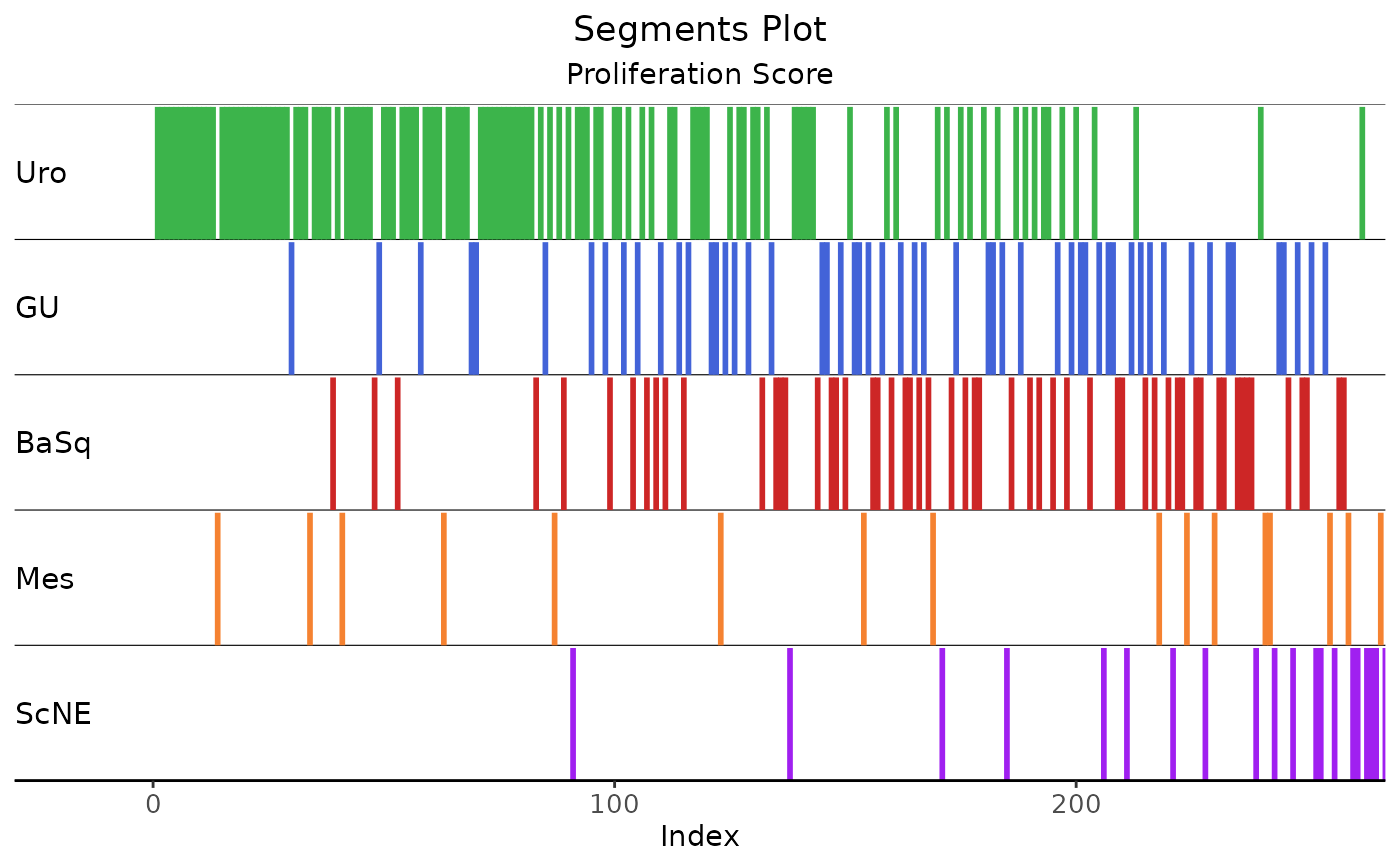
#Seg plot, all 5 classes
plot_ranked_score(these_predictions = sjodahl_classes,
this_score = "proliferation_score",
subtype_class = "5_class",
seg_plot = TRUE,
seg_width = 1)
#> Warning: The `size` argument of `element_line()` is deprecated as of ggplot2 3.4.0.
#> ℹ Please use the `linewidth` argument instead.
#> ℹ The deprecated feature was likely used in the LundTaxR package.
#> Please report the issue to the authors.
 #Seg plot, all 7 classes
plot_ranked_score(these_predictions = sjodahl_classes,
this_score = "proliferation_score",
subtype_class = "7_class",
seg_plot = TRUE,
seg_width = 1)
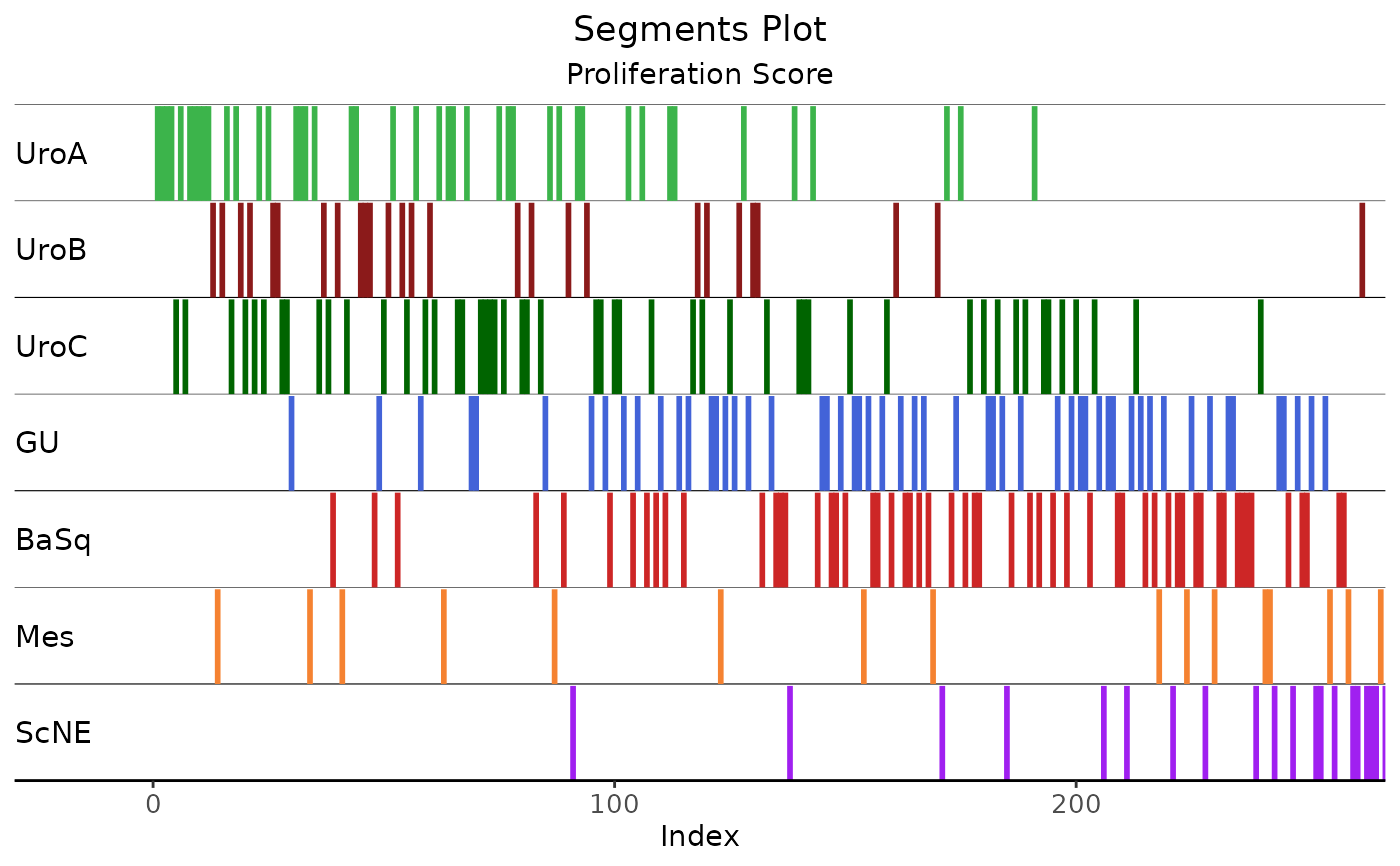
#Seg plot, all 7 classes
plot_ranked_score(these_predictions = sjodahl_classes,
this_score = "proliferation_score",
subtype_class = "7_class",
seg_plot = TRUE,
seg_width = 1)
 #rank plot, proliferation score vs 5 class subtypes
plot_ranked_score(these_predictions = sjodahl_classes,
this_score = "proliferation_score",
subtype_class = "5_class")
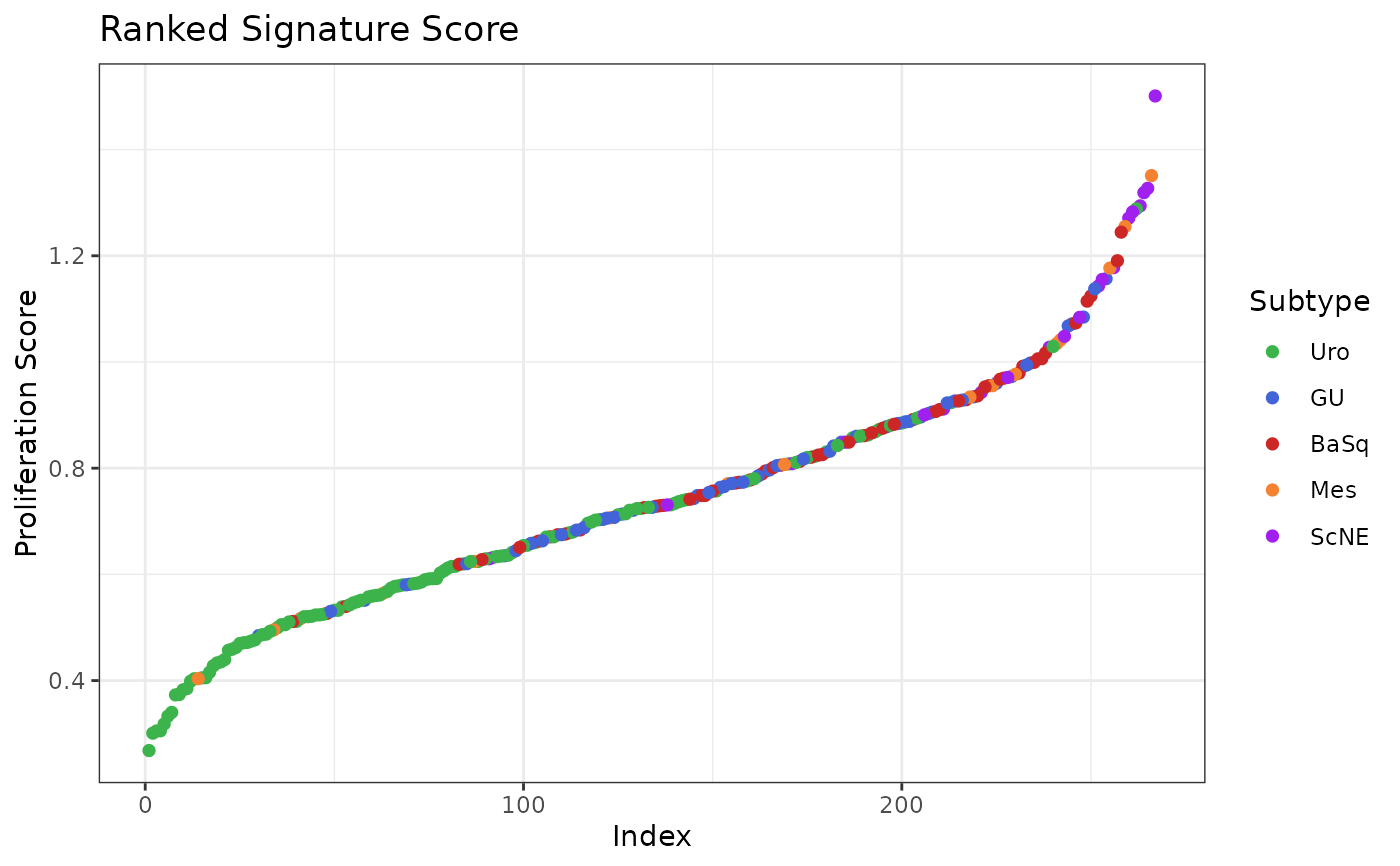
#rank plot, proliferation score vs 5 class subtypes
plot_ranked_score(these_predictions = sjodahl_classes,
this_score = "proliferation_score",
subtype_class = "5_class")
 #rank plot with statis added
plot_ranked_score(these_predictions = sjodahl_classes,
this_score = "proliferation_score",
subtype_class = "5_class",
add_stat = TRUE,
this_subtype = "GU")
#> `geom_smooth()` using formula = 'y ~ x'
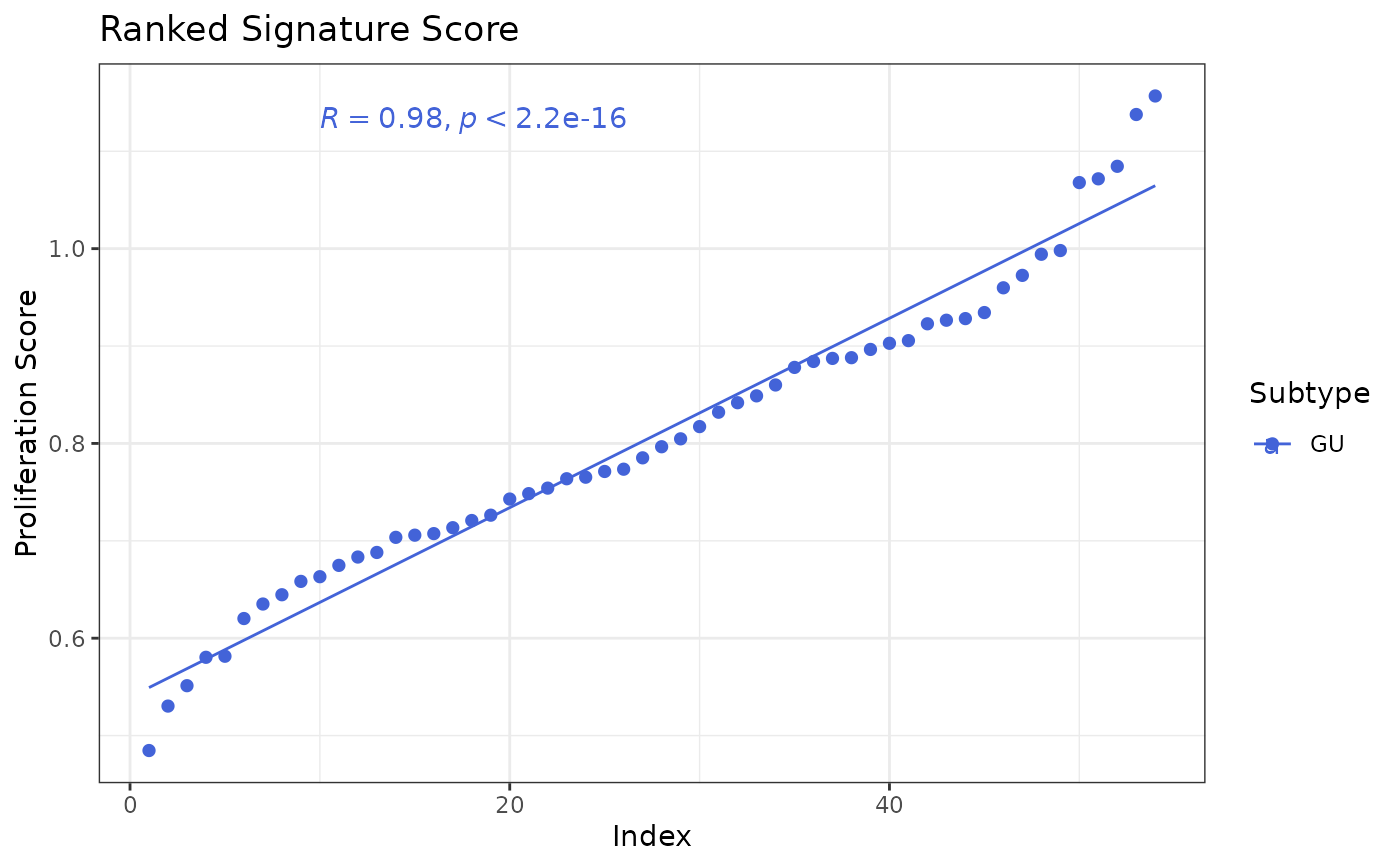
#rank plot with statis added
plot_ranked_score(these_predictions = sjodahl_classes,
this_score = "proliferation_score",
subtype_class = "5_class",
add_stat = TRUE,
this_subtype = "GU")
#> `geom_smooth()` using formula = 'y ~ x'
 #return data
ranked_proliferation = plot_ranked_score(these_predictions = sjodahl_classes,
this_score = "proliferation_score",
return_data = TRUE,
subtype_class = "7_class")
#> No plot generated, returning plot data instead...
#view data
head(ranked_proliferation)
#> sample_id score subtype rank
#> 1 1.CEL 0.7310869 UroA 139
#> 2 2.CEL 1.0419366 Mes 242
#> 3 3.CEL 0.4846604 GU 30
#> 4 4.CEL 0.6596973 UroA 103
#> 5 5.CEL 0.8079496 UroB 170
#> 6 6.CEL 0.9343730 GU 219
#return data
ranked_proliferation = plot_ranked_score(these_predictions = sjodahl_classes,
this_score = "proliferation_score",
return_data = TRUE,
subtype_class = "7_class")
#> No plot generated, returning plot data instead...
#view data
head(ranked_proliferation)
#> sample_id score subtype rank
#> 1 1.CEL 0.7310869 UroA 139
#> 2 2.CEL 1.0419366 Mes 242
#> 3 3.CEL 0.4846604 GU 30
#> 4 4.CEL 0.6596973 UroA 103
#> 5 5.CEL 0.8079496 UroB 170
#> 6 6.CEL 0.9343730 GU 219