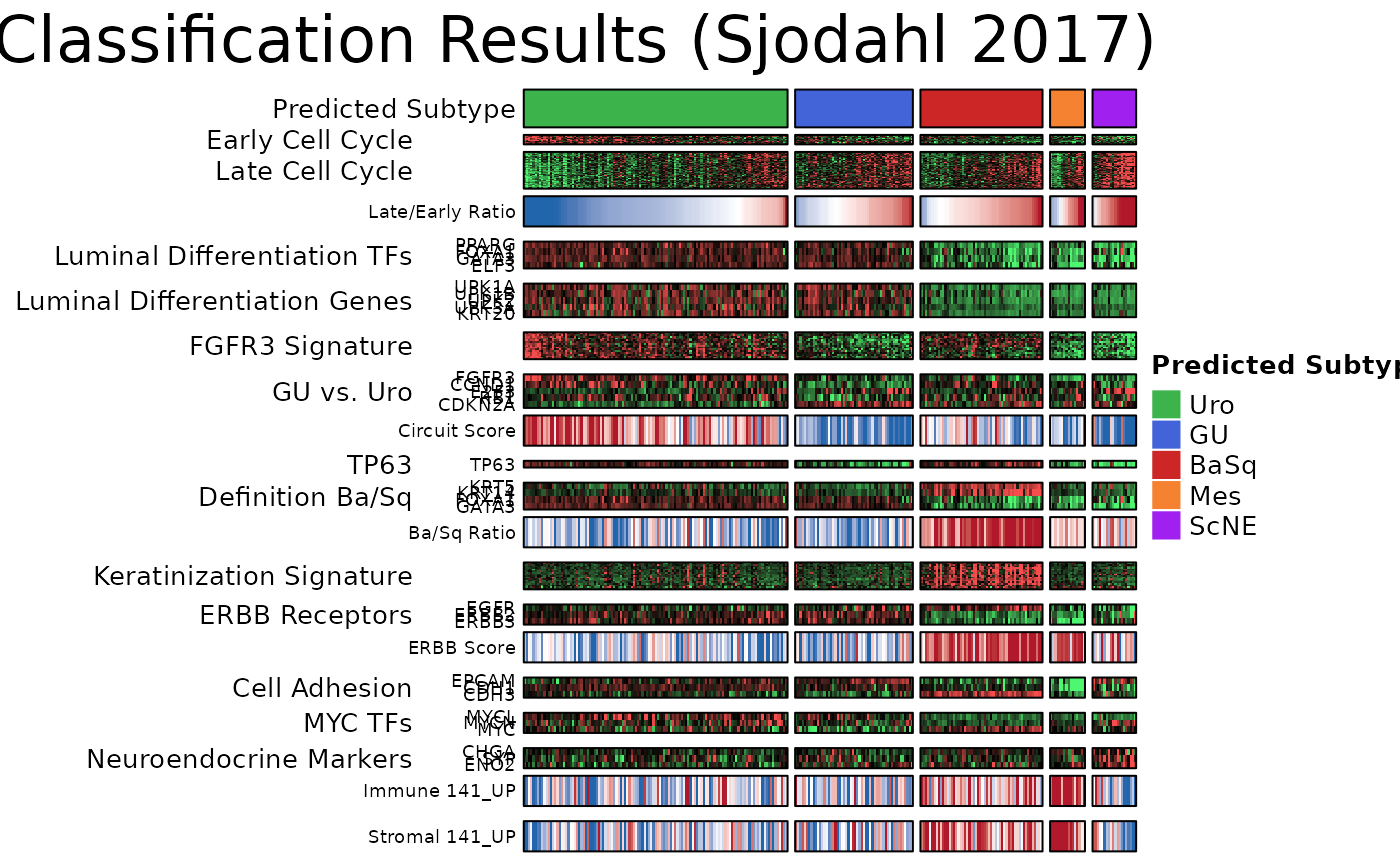
Visualize Output from the LundTaxR Classifier in a Heatmap
plot_classification_heatmap.RdPlot heatmap with classification results.
Usage
plot_classification_heatmap(
  these_predictions = NULL,
  this_data = NULL,
  gene_id = "hgnc_symbols",
  subtype_annotation = "5_class",
  this_sample_order = NULL,
  norm = TRUE,
  plot_scores = FALSE,
  plot_signature_scores = FALSE,
  custom_annotation = NULL,
  include_sections = list(early_late_cc = TRUE, luminal_tfs = TRUE, luminal_genes = TRUE,
    fgfr3 = TRUE, circuit = TRUE, tp63 = TRUE, basq = TRUE, keratinization = TRUE, erbb =
    TRUE, adhesion = TRUE, myc = TRUE, neuronal = TRUE),
  show_ann_legend = FALSE,
  show_hm_legend = FALSE,
  ann_height = 0.5,
  plot_title = "My Plot",
  plot_width = 14,
  plot_height = 11,
  plot_font_size = 10,
  plot_font_row_size = 7,
  out_path = NULL,
  out_format = "png",
  col_width = NULL
)
Arguments
- these_predictions
Required parameter, should be the output from
classify_samples().- this_data
Expression data used for predictions. Required if the output from
classify_samples()is run with include_data = FALSE (default).- gene_id
Specify the type of gene identifier used in
this_data. Accepted values are; hgnc_symbol (default) or ensembl_gene_id.- subtype_annotation
Can be one of the following; "5_class" (default) or "7_class" annotation.
- this_sample_order
Optional, set sample order. Default, samples are split by subtype, and order within each subtype. By default, samples are order by late/early cell cycle ratio (low to high).
- norm
Boolean parameter. Set to TRUE (default) to normalize the data into Z-scaled values. If FALSE, data will be row median centered for plotting.
- plot_scores
Boolean parameter. Set to TRUE to plot prediction scores for each class. Default is FALSE.
- plot_signature_scores
Boolean parameter. Set to TRUE to add signature scores heatmap after the classification heatmap. Default is FALSE.
- custom_annotation
Optional HeatmapAnnotation object to add below the existing subtype prediction annotations and score bars. Should be created with
get_custom_annotations(). Default is NULL.- include_sections
Named list specifying which heatmap sections to include. Available sections: early_late_cc, luminal_tfs, luminal_genes, fgfr3, circuit, tp63, basq, keratinization, erbb, adhesion, myc, neuronal. Each should be TRUE/FALSE. Default includes all sections (TRUE).
- show_ann_legend
Boolean parameter, set to TRUE to show annotation legend (Lund classes). Default is FALSE.
- show_hm_legend
Boolean parameter, set to TRUE to show heatmap legend, default is FALSE.
- ann_height
Plotting parameter, optional. Annotation height in cm. Default = 8.
- plot_title
Plotting parameter. The title for the generated heatmap. Default is "My Plot".
- plot_width
This parameter controls the width in inches. Default is 14 (4200 pixels at 300 PPI).
- plot_height
This parameter controls the height in pixels. Default is 10 (3000 pixels at 300 PPI)
- plot_font_size
Optional parameter to control the size of the font in the generated heatmap. Note, the title of the plot will always be twice that of the set value here (default = 10).
- plot_font_row_size
Optional parameter to control the size of the font in the generated heatmap. Note, the title of the plot will always be twice that of the set value here (default = 8).
- out_path
Optional, set path to export plot.
- out_format
Required parameter if
out_pathis specified. Can be "png" (default) or "pdf". The user can control the dimensions withplot_widthandplot_height.- col_width
Optional parameter to force column width (sample width). Useful for when comparing multiple cohorts and the width of the plot needs to be proportional to the total number of samples. Default is NULL.
Details
This function plots a heatmap including genes and signatures of interest, with prediction results and scores on top. Optionally includes signature scores heatmap.
Examples
#run classifier
sjodahl_classes = classify_samples(this_data = sjodahl_2017,
                                   log_transform = FALSE,
                                   adjust = TRUE,
                                   impute = TRUE,
                                   include_data = TRUE,
                                   verbose = FALSE)

#plot
plot_classification_heatmap(these_predictions = sjodahl_classes,
                            subtype_annotation = "5_class",
                            plot_scores = FALSE,
                            plot_title = "Classification Results (Sjodahl 2017)",
                            show_ann_legend = TRUE,
                            ann_height = 0.5)
#> No out_path provided, displaying heatmap in R session...